Anyone who has played a little with dates know how painful it can be… Even more when you want to plot this data !!
Matplotlib provides (link) a dates API, but to be honnest, even if the documentation is well maintained, I find it confusing. Maybe because they made the choice of a Gregorian-based calendar, thus breaking with the uniformity of “datetimes” as they are understood by many, and used throughout Python, in the datetime module (Time since Epoch being the norm).
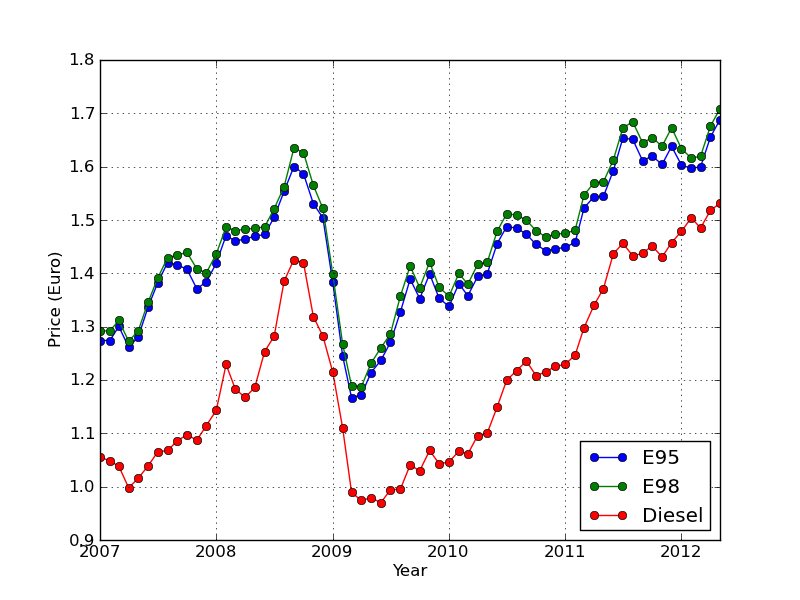
So, to start with a quite simple tutorial, I’m going to plot the evolution of fuel prices in Belgium over the last 5 years. The data is public and can be retrieved from the Belgian Statistics Office.
The key to remember is that matplotlib IS capable of understanding an axis containing objects of type datetime.datetime.
So, the input file looks like this :
200701	1.274	1.0529	1.292	1.0678	1.0563	0.866
200702	1.274	1.0747	1.292	1.0839	1.0479	0.8584
200703	1.3004	1.0427	1.3116	1.0518	1.0386	0.8247
200704	1.2617	1.0583	1.2726	1.0679	0.9978	0.8395
The columns are the month (YYYYMM format), E95, E95 excl. VAT, E98, E98 excl. VAT, Diesel and Diesel excl. VAT prices.
To read this file, we use numpy.loadtxt function :
somedates, e95, e95vatx, e98, e98vatx, dies, diesx = np.loadtxt('carburants.txt',skiprows=1,unpack=True)
The unpack=True tells numpy to separate columns into the different arrays. We then need to convert the somedates array into a real datetime array, this is done by using datetime.datetime.strptime :
xdates = [datetime.datetime.strptime(str(int(date)),'%Y%m') for date in somedates]
Which means : “for each date in the somedates array, convert the date to an int, then to a string, then create a datetime.datetime instance where the input is of format YYYYMM”. The result is an array of objects “datetime.datetime”.
Once you have that, things are so easy:
fig = plt.figure()
ax = plt.subplot(111)
plt.plot(xdates, e95,'o-',label='E95')
plt.plot(xdates, e98,'o-',label='E98')
plt.plot(xdates, dies,'o-',label='Diesel')
plt.legend(loc=4)
plt.ylabel('Price (Euro/Litre)')
plt.xlabel('Year')
plt.grid()
plt.show()
Magic!
The full code is after the break.
#
# Matplotlib Date example by geophysique.be
# tutorial 01

"""
Using : Offical mean prices of petroleum-products, last 8 years. Belgien Statistics Office.
            (http://statbel.fgov.be/fr/statistiques/chiffres/energie/prix/moyen_8/, in French)
"""

import matplotlib.pyplot as plt
import numpy as np
import datetime

somedates, e95, e95vatx, e98, e98vatx, dies, diesx = np.loadtxt('carburants.txt',skiprows=1,unpack=True)

xdates = [datetime.datetime.strptime(str(int(date)),'%Y%m') for date in somedates]

fig = plt.figure()
ax = plt.subplot(111)
plt.plot(xdates, e95,'o-',label='E95')
plt.plot(xdates, e98,'o-',label='E98')
plt.plot(xdates, dies,'o-',label='Diesel')
plt.legend(loc=4)
plt.ylabel('Price (Euro)')
plt.xlabel('Year')
plt.grid()
plt.savefig('dates-tutorial01.png')
plt.show()
And fuel prices :
200701	1.274	1.0529	1.292	1.0678	1.0563	0.866
200702	1.274	1.0747	1.292	1.0839	1.0479	0.8584
200703	1.3004	1.0427	1.3116	1.0518	1.0386	0.8247
200704	1.2617	1.0583	1.2726	1.0679	0.9978	0.8395
200705	1.2806	1.1047	1.2922	1.1123	1.0158	0.8586
200706	1.3367	1.142	1.3458	1.1493	1.0389	0.8802
200707	1.3819	1.1735	1.3907	1.1811	1.065	0.8826
200708	1.42	1.1702	1.4291	1.1853	1.0679	0.8974
200709	1.4159	1.1633	1.4343	1.1896	1.0859	0.907
200710	1.4076	1.1331	1.4394	1.164	1.0975	0.8983
200711	1.3711	1.1437	1.4084	1.1579	1.087	0.9212
200712	1.3839	1.1726	1.4011	1.1868	1.1146	0.9447
200801	1.4189	1.2157	1.4361	1.229	1.143	1.0158
200802	1.4709	1.207	1.4871	1.2231	1.2291	0.9776
200803	1.4604	1.2104	1.4799	1.2257	1.1829	0.9647
200804	1.4646	1.2145	1.483	1.2266	1.1673	0.9801
200805	1.4695	1.2173	1.4842	1.229	1.186	1.0358
200806	1.4729	1.2439	1.4871	1.2571	1.2534	1.0597
200807	1.5052	1.284	1.5212	1.291	1.2822	1.1446
200808	1.5536	1.3226	1.5621	1.3512	1.385	1.1784
200809	1.6003	1.3113	1.6349	1.3439	1.4259	1.1735
200810	1.5867	1.265	1.6262	1.2934	1.4199	1.0901
200811	1.5307	1.2429	1.565	1.2576	1.319	1.0598
200812	1.5039	1.1431	1.5217	1.1556	1.2823	1.0039
200901	1.3831	1.0289	1.3982	1.0472	1.2147	0.9174
200902	1.245	0.9643	1.2672	0.9827	1.1101	0.8174
200903	1.1668	0.9688	1.189	0.9816	0.9891	0.805
200904	1.1723	1.0031	1.1877	1.0178	0.9741	0.8093
200905	1.2137	1.0221	1.2315	1.0414	0.9793	0.8017
200906	1.2368	1.0499	1.2601	1.0631	0.97	0.8216
200907	1.2704	1.0966	1.2864	1.1211	0.9942	0.8223
200908	1.3269	1.1482	1.3566	1.1683	0.995	0.86
200909	1.3893	1.1177	1.4137	1.1348	1.0407	0.8509
200910	1.3525	1.1563	1.3731	1.1743	1.0296	0.8825
200911	1.3991	1.1182	1.4208	1.1355	1.0679	0.8621
200912	1.353	1.106	1.3739	1.1215	1.0431	0.8646
201001	1.3382	1.1412	1.357	1.1569	1.0461	0.8816
201002	1.3808	1.1222	1.3998	1.1402	1.0668	0.877
201003	1.3579	1.1522	1.3796	1.1709	1.0612	0.9056
201004	1.3941	1.1562	1.4167	1.1739	1.0958	0.9093
201005	1.399	1.203	1.4204	1.2221	1.1003	0.9497
201006	1.4556	1.2294	1.4787	1.2492	1.1492	0.9913
201007	1.4875	1.2271	1.5115	1.2474	1.1995	1.006
201008	1.4848	1.2178	1.5094	1.2393	1.2173	1.0212
201009	1.4736	1.2018	1.4995	1.2234	1.2356	0.9986
201010	1.4542	1.1921	1.4803	1.2132	1.2084	1.0043
201011	1.4424	1.1947	1.468	1.218	1.2152	1.013
201012	1.4456	1.1975	1.4738	1.2189	1.2257	1.016
201101	1.449	1.2049	1.4749	1.2239	1.2294	1.0303
201102	1.4579	1.2583	1.481	1.2785	1.2467	1.0728
201103	1.5225	1.2756	1.5469	1.2972	1.2981	1.1072
201104	1.5435	1.2762	1.5696	1.2987	1.3397	1.1335
201105	1.5442	1.3161	1.5714	1.3326	1.3715	1.1872
201106	1.5925	1.3666	1.6125	1.3825	1.4365	1.2037
201107	1.6536	1.3645	1.6729	1.3918	1.4564	1.1841
201108	1.651	1.3315	1.6841	1.3591	1.4328	1.1881
201109	1.6111	1.3388	1.6446	1.3674	1.4376	1.1996
201110	1.62	1.3257	1.6546	1.354	1.4515	1.1824
201111	1.6041	1.3536	1.6383	1.3826	1.4307	1.2044
201112	1.6379	1.3248	1.673	1.35	1.4574	1.2222
201201	1.603	1.3197	1.6335	1.3355	1.4789	1.243
201202	1.5969	1.322	1.616	1.3384	1.5041	1.2272
201203	1.5997	1.3682	1.6195	1.3851	1.4849	1.2546
201204	1.6555	1.3952	1.6761	1.412	1.5181	1.2654
201205	1.6882	1.444	1.7085	1.46	1.5311	1.2884


2 thoughts on “Matplotlib & Datetimes – Tutorial 01: Fuel Prices”