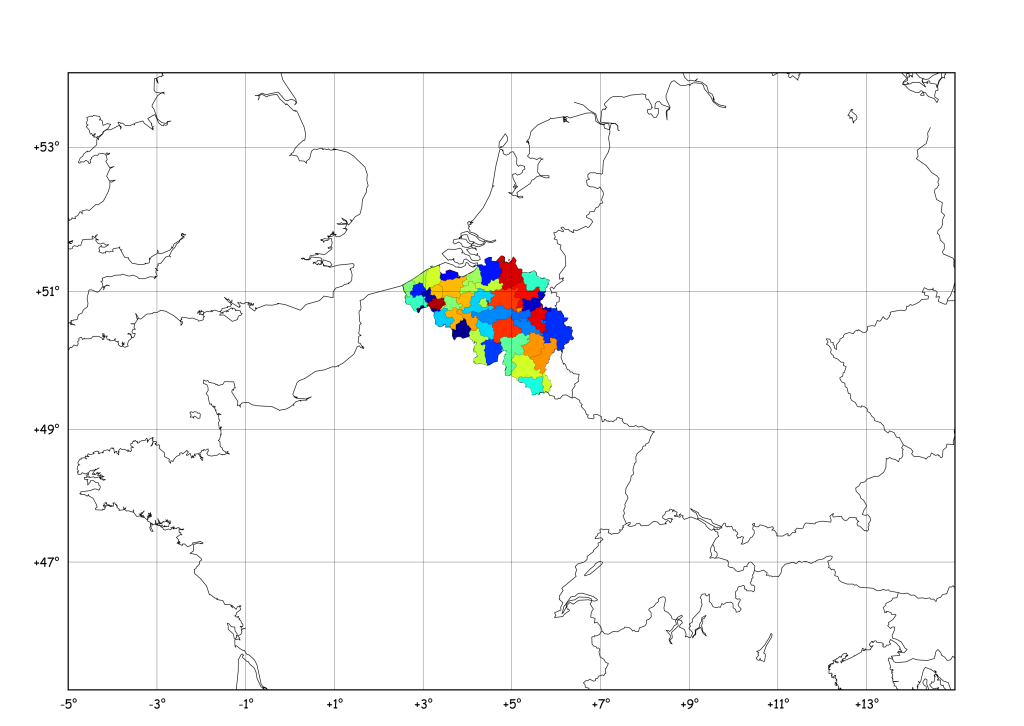
Following the comments on this year-old post I’ve had a look at pyshp which seems a little more maintained (the last line in the changelog is 1 year old…), and it is indeed a quite nice piece of code. I thus rewrote “Tutorial 7” to use this module :
The goal:
The data:
http://www.gadm.org/ saved inside a new “borders/” folder !
The idea:
Opening a GADM shapefile, get region names, and plot filled regions with random color !
The power:
We first instanciate the Basemap (see below), then import and get the shapes (from the shp file) and records (from the dbf files):
import shapefile

r = shapefile.Reader(r"borders\bel_adm3")
shapes = r.shapes()
records = r.records()
then, we get the points we need to create the matplotlib polygons:
for record, shape in zip(records,shapes):
    lons,lats = zip(*shape.points)
    data = np.array(m(lons, lats)).T
within this loop, we will also check that the shape is not in multiple parts, and if yes, segment the points in different ensembles:
    if len(shape.parts) == 1:
        segs = [data,]
    else:
        segs = []
        for i in range(1,len(shape.parts)):
            index = shape.parts[i-1]
            index2 = shape.parts[i]
            segs.append(data[index:index2])
        segs.append(data[index2:])
and finally, we plot the polygons and give them a random facecolor :
    lines = LineCollection(segs,antialiaseds=(1,))
    lines.set_facecolors(cm.jet(np.random.rand(1)))
    lines.set_edgecolors('k')
    lines.set_linewidth(0.1)
    ax.add_collection(lines)
Voilààààà 🙂
The full code is after the break:
#
# BaseMap example by geophysique.be
# tutorial 10

import numpy as np
import matplotlib.pyplot as plt
from mpl_toolkits.basemap import Basemap

### PARAMETERS FOR MATPLOTLIB :
import matplotlib as mpl
mpl.rcParams['font.size'] = 10.
mpl.rcParams['font.family'] = 'Comic Sans MS'
mpl.rcParams['axes.labelsize'] = 8.
mpl.rcParams['xtick.labelsize'] = 6.
mpl.rcParams['ytick.labelsize'] = 6.

fig = plt.figure(figsize=(11.7,8.3))
#Custom adjust of the subplots
plt.subplots_adjust(left=0.05,right=0.95,top=0.90,bottom=0.05,wspace=0.15,hspace=0.05)
ax = plt.subplot(111)
#Let's create a basemap of Europe
x1 = -5.0
x2 = 15.
y1 = 45.
y2 = 54.

m = Basemap(resolution='i',projection='merc', llcrnrlat=y1,urcrnrlat=y2,llcrnrlon=x1,urcrnrlon=x2,lat_ts=(x1+x2)/2)
m.drawcountries(linewidth=0.5)
m.drawcoastlines(linewidth=0.5)
m.drawparallels(np.arange(y1,y2,2.),labels=[1,0,0,0],color='black',dashes=[1,0],labelstyle='+/-',linewidth=0.2) # draw parallels
m.drawmeridians(np.arange(x1,x2,2.),labels=[0,0,0,1],color='black',dashes=[1,0],labelstyle='+/-',linewidth=0.2) # draw meridians

from matplotlib.collections import LineCollection
from matplotlib import cm
import shapefile

r = shapefile.Reader(r"borders\bel_adm3")
shapes = r.shapes()
records = r.records()

for record, shape in zip(records,shapes):
    lons,lats = zip(*shape.points)
    data = np.array(m(lons, lats)).T

    if len(shape.parts) == 1:
        segs = [data,]
    else:
        segs = []
        for i in range(1,len(shape.parts)):
            index = shape.parts[i-1]
            index2 = shape.parts[i]
            segs.append(data[index:index2])
        segs.append(data[index2:])

    lines = LineCollection(segs,antialiaseds=(1,))
    lines.set_facecolors(cm.jet(np.random.rand(1)))
    lines.set_edgecolors('k')
    lines.set_linewidth(0.1)
    ax.add_collection(lines)

plt.savefig('tutorial10.png',dpi=300)
plt.show()


You might also like http://scitools.org.uk/cartopy/docs/latest/examples/hurricane_katrina.html which is much less manual (and uses Cartopy instead of Basemap).
Thanks for your post. I’m new to base map and was looking to this type of work. I’m have a little issue about which files you are using after downloading. Here are the files I downloaded. You will see that I have one set that I unzipped and also the zip file is in the dir or folder too.
Your code shows the folder ‘borders’ and the filename, ‘ bel_adm3’ . No files that I downloaded is named like that. So I assume I should be importing the ‘gadm2.shp’ file is that correct? r=shapefile.Reader(r”gadm2.shp”) is that correct?
import shapefile
r = shapefile.Reader(r”borders\bel_adm3″)
shapes = r.shapes()
records = r.records()
MY Downloaded ls:
02/21/2014 03:16 AM 349,551,441 gadm_v2_shp.zip
01/20/2012 10:53 PM 515,043,378 gadm2.dbf
01/20/2012 10:52 PM 145 gadm2.prj
01/20/2012 10:53 PM 2,037,236 gadm2.sbn
01/20/2012 10:53 PM 39,668 gadm2.sbx
01/20/2012 10:53 PM 993,682,208 gadm2.shp
01/20/2012 10:53 PM 1,746,004 gadm2.shx
12/20/2011 03:07 PM 212,369 read_me.pdf
Thanks!
Hi Doglus,
Dont know if you are still dealing with that problem. The files is a zip it conatins all the files needed to build the shapes on the map you must just specify the folder with all thoses files in them. Make sure you dont doubleup on names as windows sometimes does.
Regards Kaspar
ps. I really enjoyed this tutorial it has helped me a lot in my work, I am investigating wheter basemap or cartography is better if the author has any comments that would be helpful.
Hi Thomas,
Thanks a lot for sharing this. I used your script for my travelmaps, werthmuller.org/blog/2015/travelmap.
Dieter
Hi Dieter !
Thanks ! Nice maps indeed !
Cheers
Thomas
I can’t get Angola, Argentina, Albania and other countries to display. Have you experienced the same problem? Thanks.
Hi,
This is a great tutorial—thanks very much! Unfortunately, like Douglas, I can find no way to get all the data from gadm.org. If you download the ‘whole world’ data, you get a folder called gadm28.shp, which contains a large file called gadm28.shp (and some other files)—nothing called e.g. “bel_adm3”. The only way I can see to get the individual folders is to go to gadm.org and download for each country individually. I don’t really want to do this as there are a lot of countries…
Any ideas?
Thanks!
Chris
Hi,
I am trying to plot a shapefile using Python and basemap/matplotlib. The shapefile itself contains both the polygon/shape data and the value for each polygon.
I want to plot the shapefile, and fill the polygon with a color according to the value in the polygon. Is this something you could help me with?
I have only seen guides on internet for such plotting using a csv file in addition to the shapefile.
This is an excellent starting point for one of my projects.
I had to change the dashes to [1,1] thou (lines 30 and 31, because [1,0] gave me error).
Hi,
I’m trying to adapt your code to color each country in a world map by a color – I`m using natural earth -Admin 0 – Countries. (Using Heat Map) of its economical performance.
Say I have a file like: http://data.worldbank.org/data-catalog/GDP-ranking-table
,Gross domestic product 2014,,,,,,,,
,,,,,,,,,
,,,,(millions of,,,,,
,Ranking,,Economy,US dollars),,,,,
,,,,,,,,,
USA,1,,United States,” 17,419,000 “,,,,,
CHN,2,,China,” 10,354,832 “,,,,,
JPN,3,,Japan,” 4,601,461 “,,,,,
DEU,4,,Germany,” 3,868,291 “,,,,,
GBR,5,,United Kingdom,” 2,988,893 “,,,,,
FRA,6,,France,” 2,829,192 “,,,,,
BRA,7,,Brazil,” 2,416,636 “,,,,,
ITA,8,,Italy,” 2,141,161 “,,,,,
IND,9,,India,” 2,048,517 “,,,,,
RUS,10,,Russian Federation,” 1,860,598 “,a,,,,
I I nead each country to be colored according to a color scheme (green)
Can you help me in understanding how to adopt the colortable to show this?
Thanks
Thanks very much for this. I ran into a small error and when googling it, I found a post where it looks like someone else had had it before after running the same code
http://stackoverflow.com/questions/22942855/plt-savefig-valueerror-all-values-in-the-dash-list-must-be-positive
You might get an error when running this:
ValueError(“All values in the dash list must be positive”)
See this article for a way to fix this:
http://stackoverflow.com/questions/22942855/plt-savefig-valueerror-all-values-in-the-dash-list-must-be-positive