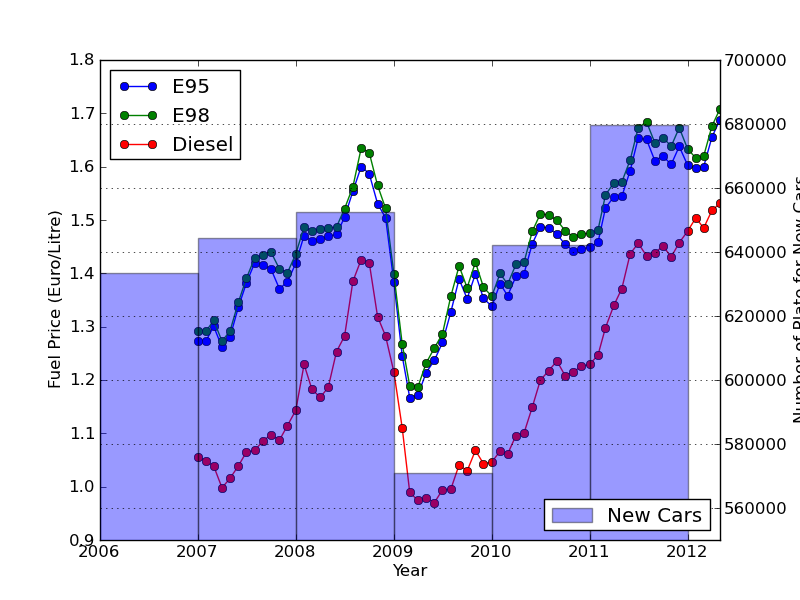
To add some interesting information to the previous tutorial, I’ve downloaded the number of licence plates given for new cars in Belgium for the same time span:
2005	587764
2006	633570
2007	644313
2008	652590
2009	571001
2010	642086
2011	679619
Load them in the same fashion:
plates, number = np.loadtxt('newplates.txt',skiprows=1,unpack=True)
xdates2 = [datetime.datetime.strptime(str(int(date)),'%Y') for date in plates]
Add another Y axis to the plot and plot them using matplotlib.pyplot.bar :
ax2 = ax.twinx()
plt.bar(xdates2,number,width=365,alpha=0.4,label='New Cars')
plt.ylim(550000,700000)
plt.legend(loc=4)
plt.ylabel('Number of Plate for New Cars')
plt.xlabel('Year')
plt.grid()
we set the bar to begin at the date and with a width of 365. Yes, the “unit” of matplotlib date-axis is “Day”.
The result is both good looking, and surprisingly shows a very nice correlation between the fuel prices and the number of new cars in Belgium…
 The full code is after the break.
#
# Matplotlib Date example by geophysique.be
# tutorial 02

"""
Using : Number of new licence plates in Belgium
            (http://statbel.fgov.be/fr/statistiques/chiffres/circulation_et_transport/circulation/immatricul/, in French)
"""

import matplotlib.pyplot as plt
import numpy as np
import datetime

somedates, e95, e95vatx, e98, e98vatx, dies, diesx = np.loadtxt('carburants.txt',skiprows=1,unpack=True)
xdates = [datetime.datetime.strptime(str(int(date)),'%Y%m') for date in somedates]

fig = plt.figure()
ax = plt.subplot(111)
plt.plot(xdates, e95,'o-',label='E95')
plt.plot(xdates, e98,'o-',label='E98')
plt.plot(xdates, dies,'o-',label='Diesel')
plt.legend(loc=2)
plt.xlabel('Year')
plt.ylabel('Fuel Price (Euro/Litre)')

plates, number = np.loadtxt('newplates.txt',skiprows=1,unpack=True)
xdates2 = [datetime.datetime.strptime(str(int(date)),'%Y') for date in plates]

ax2 = ax.twinx()
plt.bar(xdates2,number,width=365,alpha=0.4,label='New Cars')
plt.ylim(550000,700000)
plt.legend(loc=4)
plt.ylabel('Number of Plate for New Cars')
plt.xlabel('Year')
plt.grid()
plt.savefig('dates-tutorial02.png')
plt.show()


