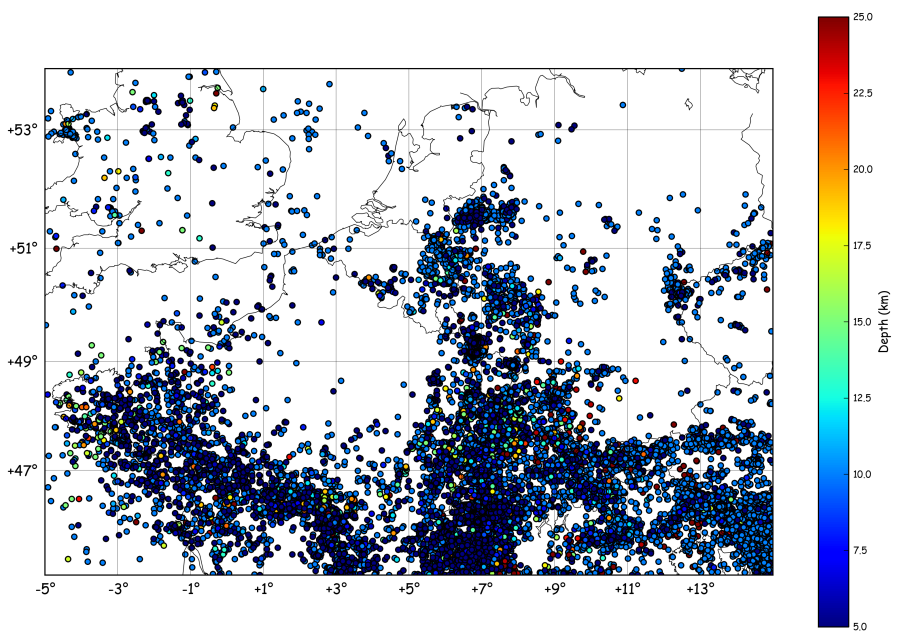
Imagine we want to plot a map of the seismic activity in NW-Europe and, at the same time, count the number events per month. To get a catalogue of earthquakes in the region, one can call the NEIC (note: this…
Thomas Lecocq @ the Royal Observatory of Belgium
Imagine we want to plot a map of the seismic activity in NW-Europe and, at the same time, count the number events per month. To get a catalogue of earthquakes in the region, one can call the NEIC (note: this…
Here is a new tutorial that will include “a bit of all” tutorials previously published on this blog and some new cool stuff to play with ! Idea: Find some resources on the Internet and plot them on the map…